But, I was very wrong. We had a ballroom in the back that could easily have seated 500 people. Very few seats were empty.
The schedule was different than any other conference I have been to. Each attendee was given a box with four books and a reading assignment. We had an hour to read before the show got started, an hour. ET walked around and signed books while we read.
Then the lights went dark and the screens lit up with small bars that moved along with the classical music:
Then we would read a section in the book, usually focused on a single graphic and he would discuss design principles from this. 500 people turning pages in unison echoes in a ballroom like waves against stones. Not a sound of talking, just scratching of pens and scraping of pages.
For example, study this map and chart by Charles Minard to describe the loss of men as Napoleon marched across Russia and back. The size of the tan and black lines correspond to the size of the army. You can easily understand the devastating losses as they marched in the freezing cold and see the despair of their retreat as they returned with only 10,000 of the original 400,000 men.

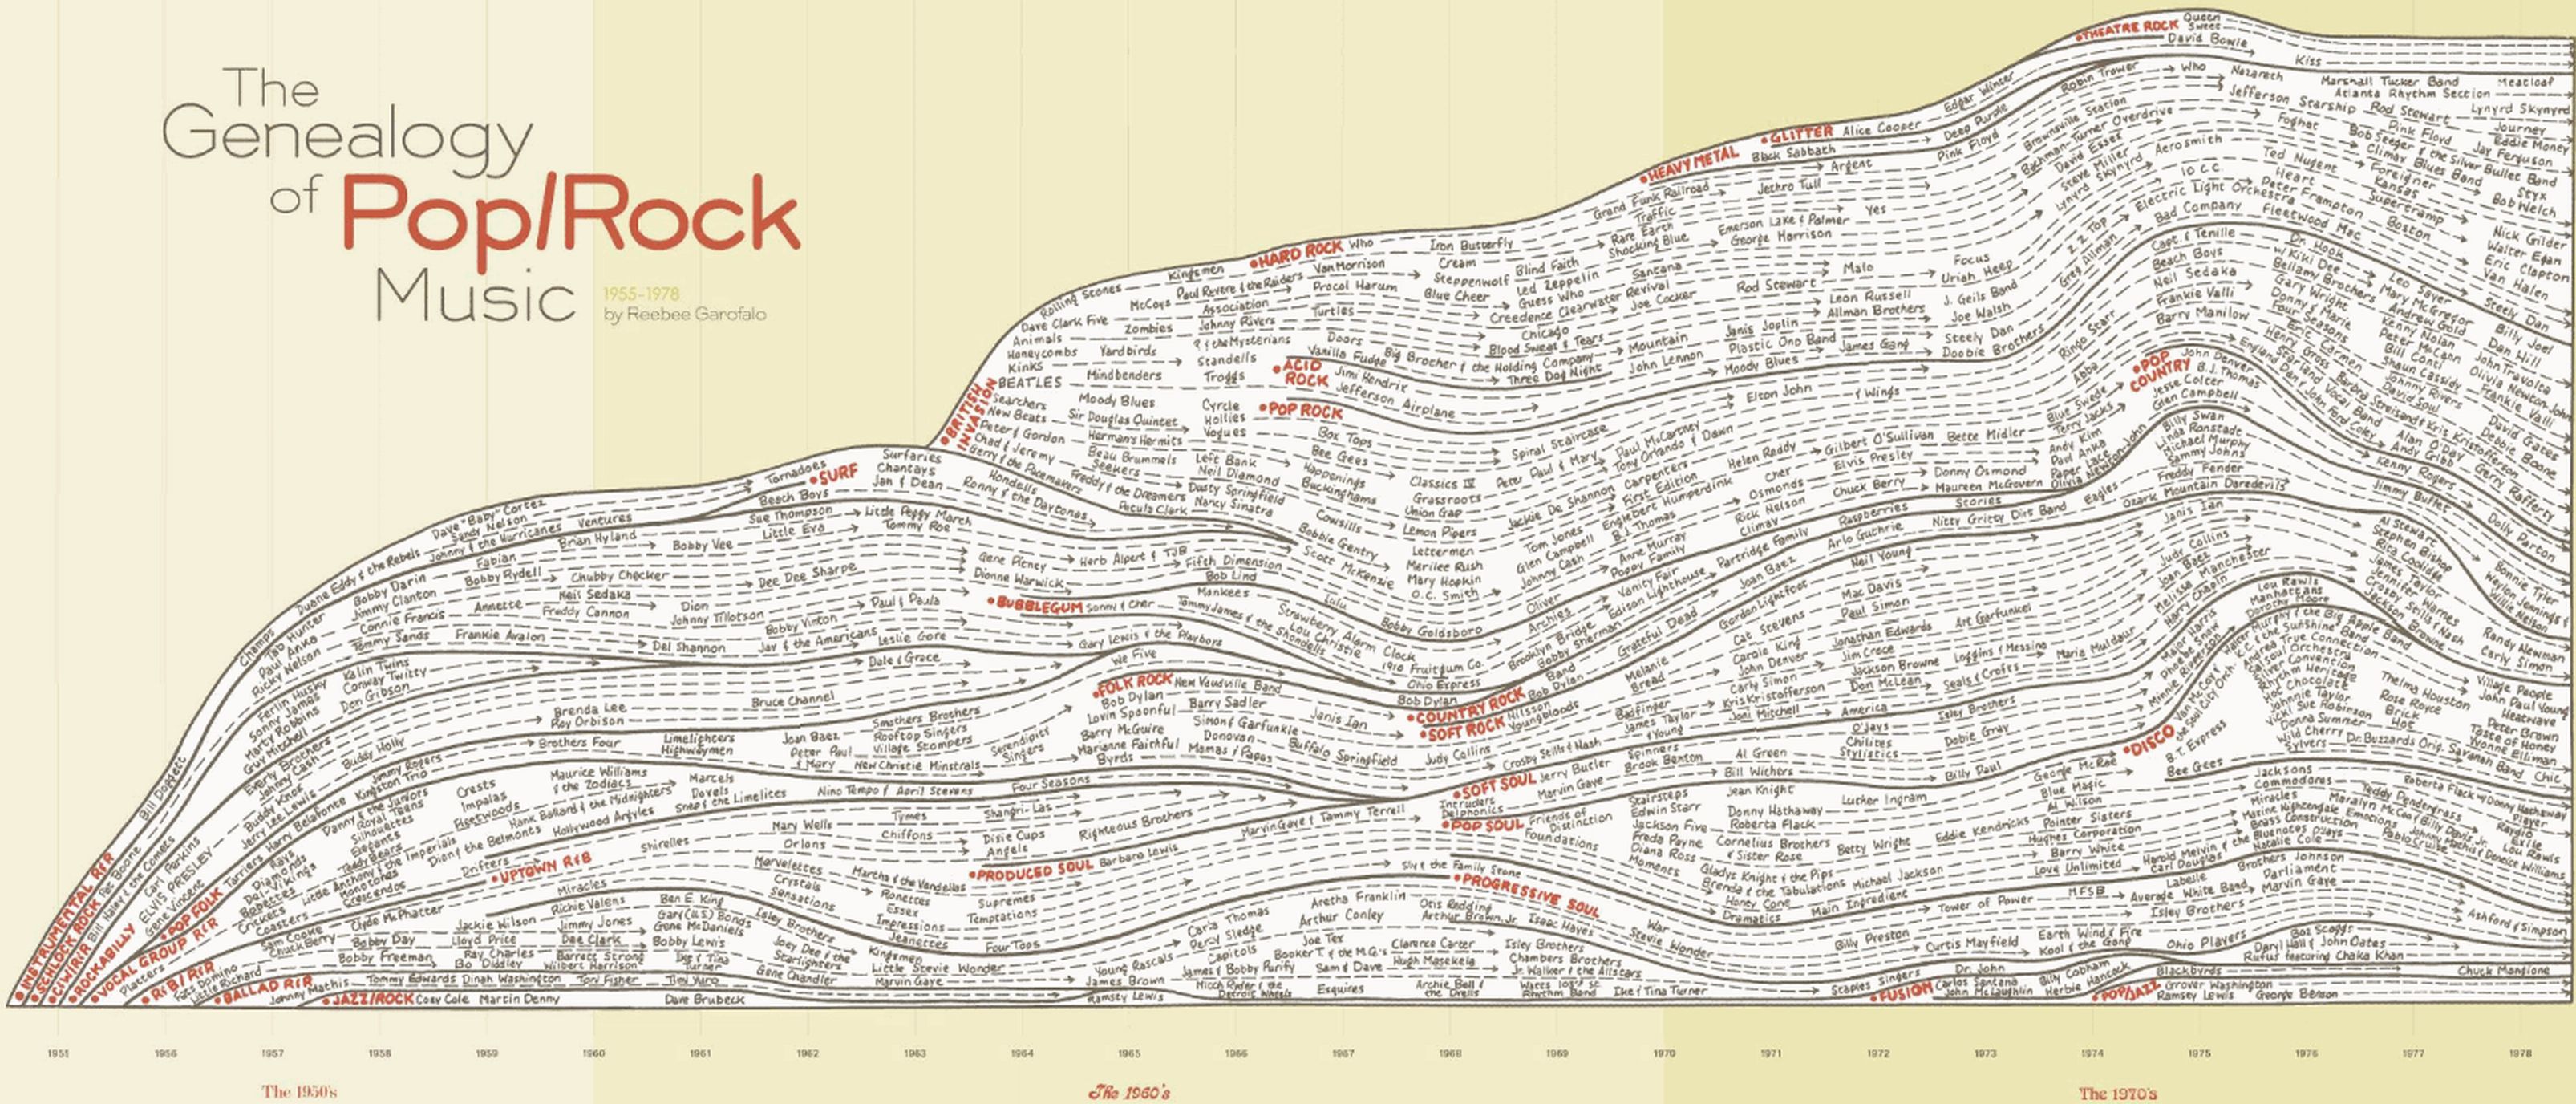
Another supergraphic we discussed in detail was Reebee Garofalo's "Genealogy of pop and rock music." You will need to click on the image and expand it to see much detail. It tracks the progress of each pop music fad with the band and the volume of record sales.
There is a lot of detail in his books about how to handle visualizations to maximize the amount of data being communicated to the reader as clearly as possible and as simply as possible and getting his books as part of this course made the steep entry fee worth it.
The take-home messages for me about graphics
1. Don't use PowerPoint - PowerPoint is inefficient at transmitting data. It is also full of clunky formatting and graphing "tools" that obscure the meaning of the presentation. Really PowerPoint is not to blame, it is our utter dependence on it for communication. I can't count how many times I have asked for data at work or wanted to discuss a proposal or results of an experiment and the only way the data is stored and communicated is through PowerPoint.
Why is that? It is faster to make a PowerPoint presentation than a technical report. Writing takes time, thought, and preparation. PowerPoint is used as a shorthand, and according to Tufte a crutch that weakens our intellectual and reasoning skills instead of healing them.
Am I giving up PowerPoint? No, but I am going to think carefully about how I am using it. I am also recommitted to technical reports and clear writing.
2. Maximize the amount of information contained in a graphic. Charts, graphs, tables, etc should help the reader to make comparisons and draw conclusions. Maximize the amount of data per amount of ink it would require for the graphic. Try to incorporate multivariate data. Get rid of chartjunk and PowerPoint ppflugh.
3. Your credibility is on the line - inaccurate and poor presentation not only weaken the argument of the presentation, but they make the presenter look bad. It is also hard to make right conclusions without understanding the data, its limitations, and relationships - see what happened with the shuttle in part due to badly written PowerPoint slides as a substitute for a technical report. How many other bad decisions have been made in bored meetings because bad presentations (misspelling intentional).
Advice for presenting data
He advocated strongly for the format used in the training session, except that with small groups questions and discussion is more feasible. He also plugged the iPad pretty hard numerous times due to its high resolution screen and ability to handle multimedia and statistics. He expects within a short while that we won't have to worry about PowerPoint because each person will come with their iPad equivalent to every meeting. Data will be exchanged and discussed with that instead of a projector and slides.
1. "Remember that the group of people most like you in the world outside your immediate family are probably in the room with you." I thought that was actually pretty profound. Taking that into consideration will prevent patronizing and should help communication.
2. High resolution data dump - use a supergraphic like the examples shown previously to give perspective and generate discussion later. He recommends giving each audience member a handout with a summary of the analysis, thoughtful graphics, and data tables.
3. Spend your presentation time letting the audience read and digest material. Data transfer rates for reading far outstrip the amount you can talk.
I am not sure how well this would work in many situations. I am willing to try it for some presentations, but I am unsure how this will go. This is not the culture and method people are used to. I can see some cases, especially if meetings are small and there is a single presenter this would work well. But, how do you do this when there are a slate of presenters or a large and varied audience? It worked well for the conference. I preferred this to the couple of times that he went on and on about the beauty of Apple products and the other time that he droned about computer interface design.
4. Guide the audience through key points and conclusions. This makes sense.
5. Let the audience interrogate you, if less than 50 people. Since they have read the material and you have explained key points, this actually should go pretty well.
6. End early. No one likes long meetings. He argued that with this method, instead of PowerPoint, we should be able to present more information in 30% less time.
Besides the few rambling and self-promoting sections about design of computer interfaces, this was a fascinating training of how to improve data quality.